There are three kinds of lies: lies, damned lies and statistics.
~Mark Twain
Not too long ago, dailycred posted a little research about using Facebook and Twitter as signup mechanisms – Surprise! People hate being forced to use Facebook. I came across the post via HackerNews.
In summary, dailycred is an account-as-a-service tool that allows developers to add authentication to their apps and sites without rolling their own. Overall, it’s pretty nifty stuff. For the post, they did a little informal survey of tourists strolling through Seattle’s Pike Place Market. In turn, they found out that when presented with the option people don’t like to sign up using Facebook or Twitter.
While I wasn’t surprised by dailycred’s conclusion, I thought there might be a better way to get some real data to back this up.
And for $150, I got my answer. Now, I’m going to share it with you.
Methodology
To set up my test, I used Google’s Consumer Surveys. Google has a whitepaper explaining how this tool works and why it’s as good if not better than doing telephone surveys. I’m going to trust that Google’s stats wizards know their stuff, but as a marketer I can tell you that the #1 awesome thing about the tool is that it’s dirt cheap as far as these things go.
The survey looked a bit like this:
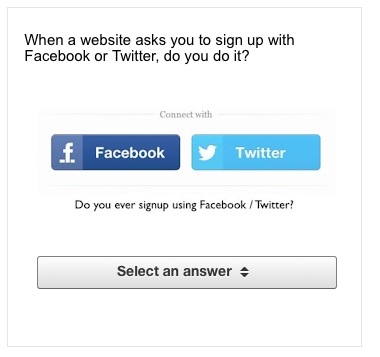
The answers included the options below served in random order. There was also a fixed, final option of “I’m not on Facebook/Twitter”:
- Yes – Because it’s easy.
- No – I don’t understand how it works.
- Yes – But I hate it.
- No – I’m scared of scams.
I ran the survey to an open sample of the general US Internet population, though Google provides other options. I also opted for the recommended 1,500 responses which came out to the aforementioned $150.
Google reviews surveys before they run and the folks working on this tool actually sent a few suggestions to me to tweak the survey for better results. I have to give a shout out there. This was service I did not expect and the survey option above represent some of their enhancements.
Results
In total, Google served the survey 16,175 times and collected 1,817 responses. This is little more than I paid for, but I assume they needed this number to reach a measure of statistical relevance.
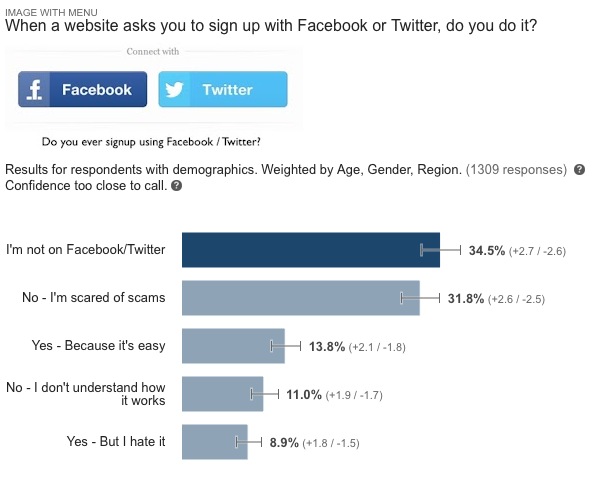
While they didn’t get a clear winner on the list of questions, a few things are very clear:
- Almost 35% of the US Internet Population is not on Facebook or Twitter
- Of those who are, nearly half are scared of scams and do not use the service for logging in.
- In total, 77% of the US Internet Population wants nothing to do with this method of logging in.
Google’s tool will also slice and dice results based on basic demographic categories: age, region, urban density, and income. From all of this information, the tool will calculate “insights”. In the case of this survey, only two insights were derived.
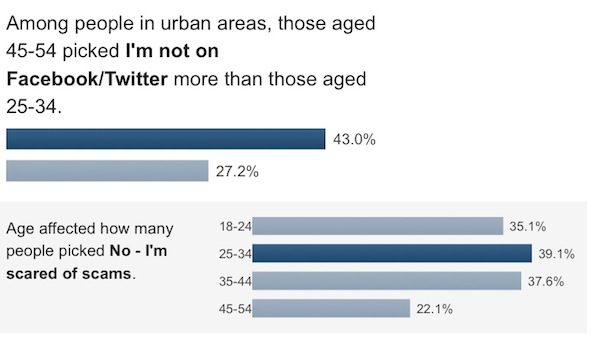
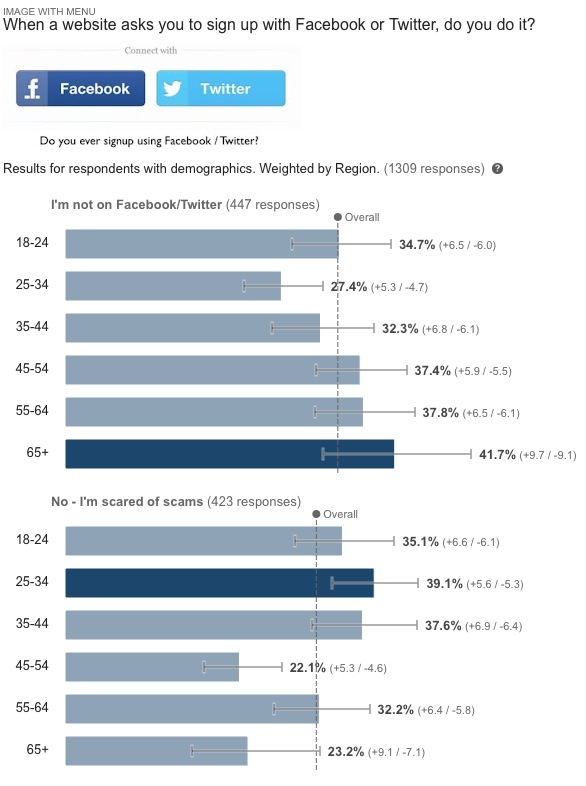
The insights didn’t surprise me too much, but I enjoyed digging into the data. Below is a comparison of the top two questions divvied up by age:
The Data Is Yours
I’ve made this survey public so that anyone can check it out, download the data, do whatever. To get there just use this link:
Public Survey Results: Facebook/Twitter Login
Enjoy!
Update
The discussion of this post on HackerNews is pretty lively. I guess my subject line was provocative.
Since posting this data, I’ve noticed a few questions about the methodology popping up. For example, a post by Diego Basch notes that I should have asked a qualifying question right up front. Totally fair, and I considered this. However, I rejected asking the qualifier due to the expense. Asking a qualifier up front (Google’s tool does provide the option) would have doubled the expense and since I was running this survey on my own dime I opted not to do it.
Instead, I gave the opt-out option as suggested by Google. It seems the final result is pretty close to research done by many others. In particular, in the discussion of Diego’s post, someone from Google Surveys actually posted a study from the Pew Internet Trust showing that in fact 66% of the US Internet Population is using Twitter/Facebook. They also go on to say that Google’s own research has produced similar results.
Another point I’ve heard is that there are not enough alternate responses. This is also a fair point. My original plan was to use 20 different variations. However, since I wasn’t creating a multi-step branching process, I needed to be sure that the number of yes/no responses were the same. They would be shown in a random order, but without the precise number of responses it’s possible that Google might show all yes answers. So, in the end, I made a judgement call and picked the responses that appeared the most in dailycred’s post (with slight modification).
Ultimately, I think Andrew Parker provides a great summary of what I was trying to achieve:
Yes, this survey design is questionable by most standards.
But, it’s not a survey design disaster and is likely a “directionally correct” reflection of internet users’ actual behavior.
Are exactly 34.5% of the US Internet Population not using fb/twitter? Of course not, but I suspect that number is pretty close.
If you’re building a social networking app, this is an opportunity.
My original goal was to see just how important Facebook/Twitter login might be to a business. I was willing to pay $150 for a surface level look at real data, but no more. I feel like I got the directional answer I needed. A finer grain study might prove interesting, but it wouldn’t suit my needs.
In any case, I hope this information has been helpful. Here are the survey results once more (for people who scroll to the bottom):